
Talaksan:Airflow-Obstructed-Duct.png
Buong resolusyon ((1,270 × 907 pixel, laki ng talaksan: 85 KB, uri ng MIME: image/png))
|
|
Ito ay isang talaksan mula sa Wikimedia Commons. Makikita sa ibaba ang impormasyon mula sa pahina ng paglalarawan nito roon. |
Buod

|
File:N S Laminar.svg is a vector version of this file. It should be used in place of this PNG file when not inferior.
File:Airflow-Obstructed-Duct.png → File:N S Laminar.svg
For more information, see Help:SVG. |
 |
| Paglalarawan |
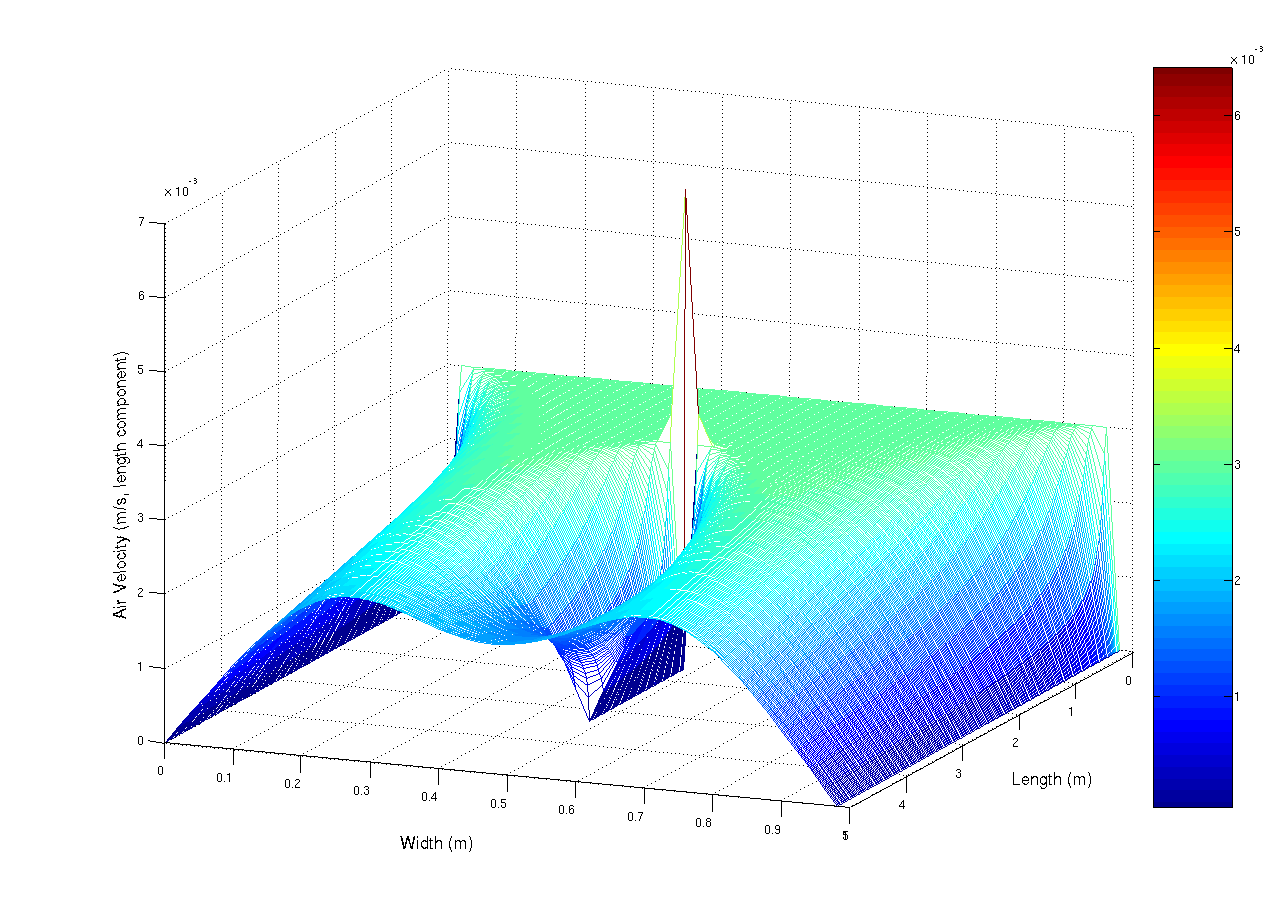
A simulation using the navier-stokes differential equations of the aiflow into a duct at 0.003 m/s (laminar flow). The duct has a small obstruction in the centre that is parallel with the duct walls. The observed spike is mainly due to numerical limitations. This script, which i originally wrote for scilab, but ported to matlab (porting is really really easy, mainly convert comments % -> // and change the fprintf and input statements) Matlab was used to generate the image.
%Matlab script to solve a laminar flow
%in a duct problem

%Constants
inVel = 0.003; % Inlet Velocity (m/s)
fluidVisc = 1e-5; % Fluid's Viscoisity (Pa.s)
fluidDen = 1.3; %Fluid's Density (kg/m^3)

MAX_RESID = 1e-5; %uhh. residual units, yeah...
deltaTime = 1.5; %seconds?
%Kinematic Viscosity
fluidKinVisc = fluidVisc/fluidDen;

%Problem dimensions
ductLen=5; %m
ductWidth=1; %m

%grid resolution
gridPerLen = 50; % m^(-1)
gridDelta = 1/gridPerLen;
XVec = 0:gridDelta:ductLen-gridDelta;
YVec = 0:gridDelta:ductWidth-gridDelta;

%Solution grid counts
gridXSize = ductLen*gridPerLen;
gridYSize = ductWidth*gridPerLen;

%Lay grid out with Y increasing down rows
%x decreasing down cols
%so subscripting becomes (y,x) (sorry)
velX= zeros(gridYSize,gridXSize);
velY= zeros(gridYSize,gridXSize);
newVelX= zeros(gridYSize,gridXSize);
newVelY= zeros(gridYSize,gridXSize);

%Set initial condition

for i =2:gridXSize-1
for j =2:gridYSize-1
velY(j,i)=0;
velX(j,i)=inVel;
end
end

%Set boundary condition on inlet
for i=2:gridYSize-1
velX(i,1)=inVel;
end

disp(velY(2:gridYSize-1,1));

%Arbitrarily set residual to prevent
%early loop termination
resid=1+MAX_RESID;

simTime=0;

while(deltaTime)
 count=0;
while(resid > MAX_RESID && count < 1e2)
 count = count +1;
for i=2:gridXSize-1
for j=2:gridYSize-1
newVelX(j,i) = velX(j,i) + deltaTime*( fluidKinVisc / (gridDelta.^2) * ...
(velX(j,i+1) + velX(j+1,i) - 4*velX(j,i) + velX(j-1,i) + ...
velX(j,i-1)) - 1/(2*gridDelta) *( velX(j,i) *(velX(j,i+1) - ...
velX(j,i-1)) + velY(j,i)*( velX(j+1,i) - velX(j,i+1))));

newVelY(j,i) = velY(j,i) + deltaTime*( fluidKinVisc / (gridDelta.^2) * ...
(velY(j,i+1) + velY(j+1,i) - 4*velY(j,i) + velY(j-1,i) + ...
velY(j,i-1)) - 1/(2*gridDelta) *( velY(j,i) *(velY(j,i+1) - ...
velY(j,i-1)) + velY(j,i)*( velY(j+1,i) - velY(j,i+1))));
end
end

%Copy the data into the front
for i=2:gridXSize - 1
for j = 2:gridYSize-1
velX(j,i) = newVelX(j,i);
velY(j,i) = newVelY(j,i);
end
end

%Set free boundary condition on inlet (dv_x/dx) = dv_y/dx = 0
for i=1:gridYSize
velX(i,gridXSize)=velX(i,gridXSize-1);
velY(i,gridXSize)=velY(i,gridXSize-1);

    end

    %y velocity generating vent
    for i=floor(2/6*gridXSize):floor(4/6*gridXSize)
        velX(floor(gridYSize/2),i) = 0;
        velY(floor(gridYSize/2),i-1) = 0;
    end

%calculate residual for
%conservation of mass
resid=0;
for i=2:gridXSize-1
for j=2:gridYSize-1
%mass continuity equation using central difference
%approx to differential
resid = resid + (velX(j,i+ 1)+velY(j+1,i) - ...
(velX(j,i-1) + velX(j-1,i)))^2;
end
end

resid = resid/(4*(gridDelta.^2))*1/(gridXSize*gridYSize);
fprintf('Time %5.3f \t log10Resid : %5.3f\n',simTime,log10(resid));


simTime = simTime + deltaTime;
end
mesh(XVec,YVec,velX)
deltaTime = input('\nnew delta time:');
end
%Plot the results
mesh(XVec,YVec,velX)
|
| Petsa | 24 Pebrero 2007 (original upload date) |
| Pinanggalingan | Transferred from en.wikipedia to Commons. |
| May-akda | User A1 at English Wikipedia |
Paglilisensiya
| Ang akdang ito ay pinakawalan sa sakop ng madla ng may-akda nito, si User A1 at English Wikipedia. Magagamit ito sa buong daigdig. Maaaring hindi ito posibleng legal sa ilang mga bansa; kung ganito: Ibinibigay ni User A1 kaninuman ang karapatang gamitin ang akdang ito para sa anumang layunin, na walang anumang kundisyon, maliban na lamang kung ang ganyang mga kundisyon ay kinakailangan sa batas. |
Tala ng orihinal na pagkarga
- 2007-02-24 05:45 User A1 1270×907×8 (86796 bytes) A simulation using the navier-stokes differential equations of the aiflow into a duct at 0.003 m/s (laminar flow). The duct has a small obstruction in the centre that is paralell with the duct walls. The observed spike is mainly due to numerical limitatio
Nakaraan ng file
Pindutin ang araw/oras upang makita kung papaano ang itsura ng talaksan noong oras na iyon.
| Araw/Oras | Thumbnail | Mga dimensiyon | tagagamit | Kumento | |
|---|---|---|---|---|---|
| ngayon | 15:52, 1 Mayo 2007 | | 1,270 × 907 (85 KB) | Smeira | {{Information |Description=A simulation using the navier-stokes differential equations of the aiflow into a duct at 0.003 m/s (laminar flow). The duct has a small obstruction in the centre that is paralell with the duct walls. The observed spike is mainly |
Mga ugnay
Nakaturo sa talaksan na ito ang mga sumusunod na mga pahina:
Pandaigdigang paggamit sa file
Ginagamit ng mga sumusunod na wiki ang file na ito:
- Paggamit sa anp.wikipedia.org
- Paggamit sa ar.wikipedia.org
- Paggamit sa ba.wikipedia.org
- Paggamit sa bg.wikipedia.org
- Paggamit sa bn.wikipedia.org
- Paggamit sa ca.wikipedia.org
- Paggamit sa ckb.wikipedia.org
- Paggamit sa cs.wikipedia.org
- Paggamit sa de.wikipedia.org
- Paggamit sa en.wikipedia.org
- Paggamit sa en.wikiquote.org
- Paggamit sa es.wikipedia.org
- Paggamit sa fa.wikipedia.org
- Paggamit sa he.wikipedia.org
- Paggamit sa hif.wikipedia.org
- Paggamit sa hi.wikipedia.org
- Paggamit sa hr.wikipedia.org
- Paggamit sa hy.wikipedia.org
- Paggamit sa id.wikipedia.org
- Paggamit sa jv.wikipedia.org
- Paggamit sa ko.wikipedia.org
- Paggamit sa ko.wikiversity.org
- Paggamit sa map-bms.wikipedia.org
- Paggamit sa ms.wikipedia.org
- Paggamit sa mwl.wikipedia.org
- Paggamit sa pt.wikipedia.org
- Isaac Newton
- Equação diferencial
- Equações de Navier-Stokes
- Equação diferencial linear
- Equação diferencial de Bernoulli
- Equação diferencial de d'Alembert
- Decaimento exponencial
- Equação de Laplace
- Equação diferencial parcial
- Equação de Poisson
- Equação do calor
- Lema de Grönwall
- Teorema de Picard-Lindelöf
- Método de Runge-Kutta
- Equação de Mason-Weaver
- Equação do pêndulo
- Equação de onda
Tingnan ang karagdagang pandaigdigang paggamit sa file na ito.