
Talaksan:Student t pdf.svg

Size of this PNG preview of this SVG file: 360 x 288 na pixel. Ibang resolusyon: 300 x 240 na pixel | 600 x 480 na pixel | 960 x 768 na pixel | 1,280 x 1,024 na pixel | 2,560 x 2,048 na pixel.
Buong resolusyon ((Larawang SVG, tinatayang 360 × 288 mga pixel, laki ng talakasan: 39 KB))
|
|
Ito ay isang talaksan mula sa Wikimedia Commons. Makikita sa ibaba ang impormasyon mula sa pahina ng paglalarawan nito roon. |
Buod
| Paglalarawan |
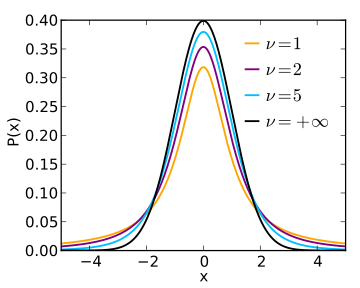
English: Plot of the density function for several members of the Student t family. |
| Petsa | |
| Pinanggalingan | Sariling gawa |
| May-akda | Skbkekas |
| SVG genesis | This plot was created with Matplotlib. |
| Source code | Python code# Origin: Skbkekas
# Enhanced: Ika, 2013-07-24
import numpy as np
import matplotlib.pyplot as plt
import scipy.special as sp
col = ['orange', 'purple', 'deepskyblue']
X = np.arange(-5, 5, 0.001)
plt.clf()
plt.figure(figsize=(4,3.2))
plt.axes([0.17,0.13,0.79,0.8])
plt.hold(True)
A = []
for k,nu in enumerate([1,2,5]):
Y = -(nu+1)*np.log(1+X**2/nu)/2
Y += sp.gammaln((nu+1)/2.0)
Y -= sp.gammaln(nu/2.0)
Y -= 0.5*np.log(nu*np.pi)
a = plt.plot(X, np.exp(Y), '-', color=col[k], lw=1.5)
A.append(a[0])
# Draw the curve of Normal distribution, which is the limit of t-distribution sequence.
mu = 0 # mean = 0
sigma = 1 # variance = 1
M = 1/(sigma*np.sqrt(2*np.pi))
N = np.exp(-(X-mu)*(X-mu)/(2*sigma*sigma));
Y = M*N
a = plt.plot(X, Y, '-', color='black', lw=1.5)
A.append(a[0])
plt.xlabel("x")
plt.ylabel("P(x)")
bx = plt.legend(A, (r"$\nu=1$", r"$\nu=2$", r"$\nu=5$", r"$\nu=+\infty$"),\
numpoints=1, handlelen=0.05, handletextpad=0.4,\
loc="upper right")
bx.draw_frame(False)
plt.xlim(-5,5)
plt.savefig("student_t_pdf.pdf")
plt.savefig("student_t_pdf.svg")
|
Paglilisensiya
Ako, na may karapatang-ari ng akdang ito, ang naglalathala nito alinsunod sa ilalim ng sumusunod na mga lisensya:
Ang talaksang ito ay nakalisensiya sa ilalim ng lisensiyang Creative Commons Atribusyon 3.0 Walang Daungan.
- Malaya kang:
- para ibahagi – para kopyahin, ipamahagi, at i-transmit ang akda
- para i-remix – para i-adapt ang akda
- Sa ilalim ng mga kondisyong ito:
- atribusyon – Dapat magbigay ka ng isang maayos na pag-credit, ibigay ang link sa lisensiya, at tukuyin kung may mga pagbabagong ginawa. Magagawa mo ito sa isang risonableng paraan, pero hindi sa paraan na para bang ineendorso ka o ng paggamit mo ng naglisensiya sa'yo.
Nakaraan ng file
Pindutin ang araw/oras upang makita kung papaano ang itsura ng talaksan noong oras na iyon.
| Araw/Oras | Thumbnail | Mga dimensiyon | tagagamit | Kumento | |
|---|---|---|---|---|---|
| ngayon | 05:45, 21 Hulyo 2013 | | 360 × 288 (39 KB) | IkamusumeFan | 1. Using \nu instead of df; 2. The previous edition used 1000 to stand for infinity case. The limit of the t-distribution sequence is normal distribution. Thus, we use normal distribution instead. |
| 15:36, 4 Marso 2010 |  | 360 × 288 (30 KB) | Skbkekas | Last file was incorrectly uploaded as cdf. | |
| 15:35, 4 Marso 2010 |  | 360 × 288 (27 KB) | Skbkekas | Changed df's to give better spacing, used thinner lines. | |
| 04:08, 23 Pebrero 2010 |  | 360 × 288 (32 KB) | Skbkekas | {{Information |Description={{en|1=Plot of the density function for several members of the Student t family.}} |Source={{own}} |Author=Skbkekas |Date=2010-02-22 |Permission= |other_versions= }} [[Category:Statistical charts and diagrams] |
Mga ugnay
Nakaturo sa talaksan na ito ang mga sumusunod na mga pahina:
Pandaigdigang paggamit sa file
Ginagamit ng mga sumusunod na wiki ang file na ito:
- Paggamit sa be.wikipedia.org
- Paggamit sa ca.wikipedia.org
- Paggamit sa cs.wikipedia.org
- Paggamit sa en.wikipedia.org
- Paggamit sa en.wikibooks.org
- Paggamit sa fi.wikipedia.org
- Paggamit sa it.wikipedia.org
- Paggamit sa ja.wikipedia.org
- Paggamit sa jv.wikipedia.org
- Paggamit sa ko.wikipedia.org
- Paggamit sa no.wikipedia.org
- Paggamit sa simple.wikipedia.org
- Paggamit sa sq.wikipedia.org
- Paggamit sa sr.wikipedia.org